
 Available in US
Content
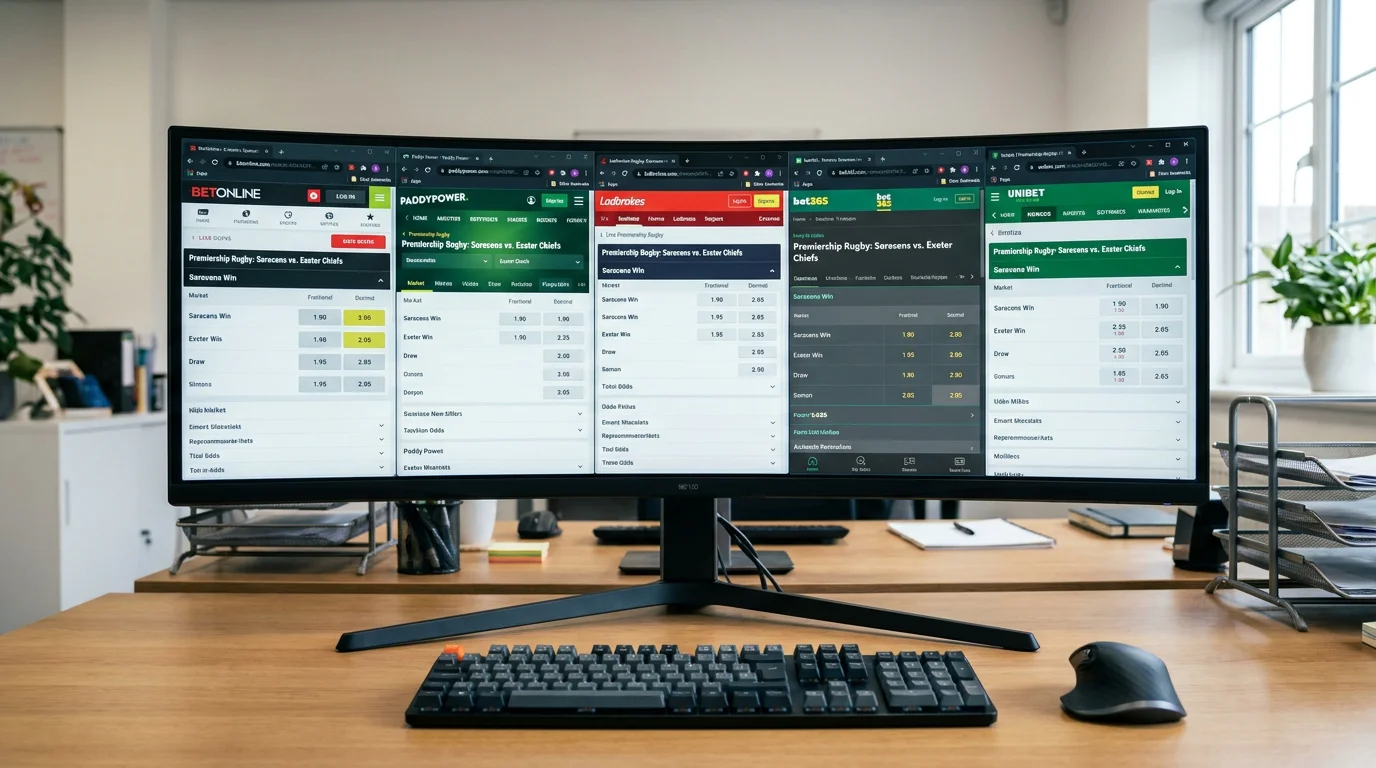
Remote betting brought in GBP 599 million in gross gambling yield during Q4 2025 alone — a figure that reflects the sheer scale of money flowing through UK sports betting markets every quarter. Within that flow, the prices offered by different bookmakers for the same rugby bet can vary by meaningful margins. A handicap line priced at 10/11 with one operator might sit at evens with another, and over the course of a season, consistently taking the better price adds percentage points to your return that no amount of match analysis can replicate. Odds comparison is the single most underrated habit in rugby betting.
I resisted line shopping for my first two years because it felt tedious. I had my preferred bookmaker, I liked the interface, and checking four or five sites before every bet seemed like overkill. Then I ran the numbers on what I would have earned had I taken the best available price on every bet I placed during a full Premiership season. The difference was 3.2% on return on investment. That margin turned a marginally losing season into a modestly profitable one. I have never placed a bet without checking at least three operators since.
Why Odds Vary and How It Affects Your Bottom Line
By 2029, the UK online sports betting market is expected to serve 15.3 million users. Each bookmaker within that market sets their own odds based on their risk exposure, the money they have already taken, their traders’ models and their desired margin. These factors differ from operator to operator, which means the price you see on any given rugby market is not the “correct” price — it is one operator’s opinion, shaped by commercial pressures as much as statistical analysis.

The variation is widest in markets with lower volume. Match result odds on a Six Nations fixture might differ by only one or two percentage points across operators because the volume is enormous and the competition between bookmakers compresses the margins. Handicap odds on a midweek Premiership fixture or a try scorer price on a Super League match can differ by ten percentage points or more, because fewer bettors are shopping that specific market and the bookmaker has less competitive pressure to sharpen the price.

The impact on your bottom line is arithmetic but powerful. If you place 200 rugby bets over a season at an average stake of GBP 20, and you consistently get odds 3% better than you would have from a single operator, you earn an additional GBP 120 across the season. That is pure profit generated not from better analysis but from better execution. It compounds over years, and it requires no additional skill beyond the discipline to check prices before clicking “place bet.”

Manual Checking vs Odds Aggregators: Pros and Cons
There are two ways to compare rugby odds: do it yourself across multiple operator websites, or use an odds aggregator that pulls prices from dozens of bookmakers onto a single page. Both work. Neither is perfect.
Manual checking gives you full control. You see the exact market, the exact selection, and you can verify that the terms match (some operators include overtime in their totals lines, others do not). The downside is time: checking four to six bookmakers for every bet adds five to ten minutes per selection. I use manual checking for my most important bets — high-conviction handicaps and tournament outrights — where the stakes justify the extra effort and where I want to confirm the terms line by line.
Odds aggregators save time by displaying all available prices on a single screen. The best ones cover a wide range of UKGC-licensed operators and update in near real time. The downside is that aggregator data can lag behind the actual market, particularly close to kick-off when odds are moving quickly. I have been caught out by stale prices on an aggregator that no longer existed when I clicked through to the operator’s site. Aggregators are best used as a screening tool — identify which operators are offering the best price, then verify directly on the operator’s site before placing the bet.

One additional consideration: maintaining active accounts with multiple operators requires managing login credentials, deposits and withdrawals across several platforms. I keep accounts with five bookmakers and two exchanges, which gives me sufficient coverage for rugby markets without becoming unmanageable. Each account carries a small working balance — enough for two or three bets — so my capital is not locked up across too many platforms.

A Quick Pre-Bet Odds Check Routine
My pre-bet routine takes less than five minutes and follows the same steps every time. First, I decide on the selection and market type based on my analysis. Second, I check the price at my default operator. Third, I check two or three alternative operators for the same market. Fourth, I note the best price and whether it differs materially from my default (I define “materially” as a price difference that changes the implied probability by 2% or more). Fifth, I place the bet at the best-priced operator.
If the best price is at an exchange rather than a bookmaker, I factor in the commission. Exchange odds look better on the surface, but the 2-5% commission on winnings means the effective price is lower than the displayed price. I calculate the net effective odds before comparing: an exchange price of 2.10 with 5% commission delivers a net return of 2.045, which may or may not beat a bookmaker’s price of 2.00 depending on the specific commission tier.

This routine becomes automatic after a few weeks. The mental effort drops to near zero, and the financial benefit accumulates silently in the background of every bet you place. Line shopping is not a strategy in itself — it is a multiplier on top of whatever analytical strategy you already use. For a deeper look at how to assess whether the price you are getting genuinely represents value, my value betting guide covers expected value calculations that complement the odds comparison process.
How much difference does line shopping make on a typical rugby bet?
On average, consistently taking the best available price across four to five operators adds 2-4% to your return on investment over a full season. That figure is based on my own records across 200+ annual rugby bets. The impact is larger on lower-volume markets (try scorer, winning margin) where price discrepancies are wider, and smaller on high-volume markets (Six Nations match result) where competition between operators compresses the margins.
Are exchange odds always better than bookmaker odds for rugby?
Not always. Exchange odds are often better for popular selections where the market is liquid, but exchange commission (typically 2-5% of net winnings) reduces the effective return. For less-liquid rugby markets, exchanges may have wider spreads or insufficient available money to fill your bet. I compare the net effective exchange price (after commission) with the best bookmaker price before deciding where to place each bet.
